


Leadership, collaboration, and unwavering commitment defined India’s outstanding performance during Lions Year 2025–2026, bringing the country one step closer to achieving the ambitious MISSION 1.5 goals.
Under the inspiring leadership of International President A.P. Singh, supported by three GAT Constitutional Area Leaders, nine GAT Area Leaders, and three Vice Area Leaders, India demonstrated what can be accomplished when leaders at every level work with a shared vision and purpose.
Collaboration, Accomplishments, Recognition
The results India saw:
- 107% achievement of the New Clubs target
- 80% achievement of the New Members target
- 77% achievement of the Net Gain target
- 93% achievement of the Recruitment target
One of the encouraging milestones was that 70 out of India’s 84 districts (~83%) concluded the Lions year with a positive net gain—a testament to the dedication and perseverance of Lions across the country.
These accomplishments were driven by a culture of collaboration, continuous engagement, and innovative leadership initiatives. Throughout the year, leaders remained closely connected with districts through regular review meetings, mentoring sessions, and proactive problem-solving, ensuring that challenges were addressed promptly and opportunities were maximized.
Several recognition initiatives played a key role in motivating district leaders to excel. The LCOI Regional Membership Recognition celebrated District Governors who achieved exceptional membership growth, recognizing districts that recorded 10–24% growth and those that surpassed the 25% growth milestone.
Building on this momentum, the Vice District Governor Challenge encouraged future leaders to drive membership growth and strengthen their districts. As a result, 75 First Vice District Governors and 75 Second Vice District Governors qualified for recognition at the 2026 Lions International Convention.
The Strong Finish Challenge further energized districts during the final phase of the Lions year, with 25 Districts of India successfully meeting the challenge criteria and demonstrating exceptional commitment to finishing the year strong.
Behind every achievement was the collective effort of thousands of Lions—from club members and district leaders to constitutional area leadership—all working together with a common purpose: strengthening service through membership growth.
As we enter Lions Year 2026–2027, the momentum continues. With a strong leadership team, proven strategies, and an unwavering commitment to service, India is well-positioned for the final lap of MISSION 1.5. The journey so far has demonstrated that when Lions unite behind a shared vision, extraordinary results follow.
CA Leaders
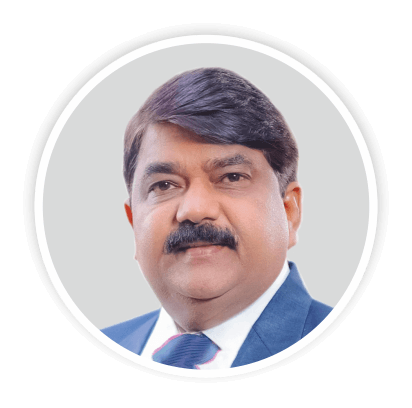
PID Jitendra Kumar Singh Chauhan
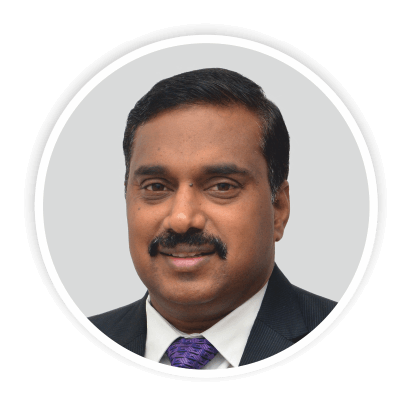
PID Sampath Ranganathan
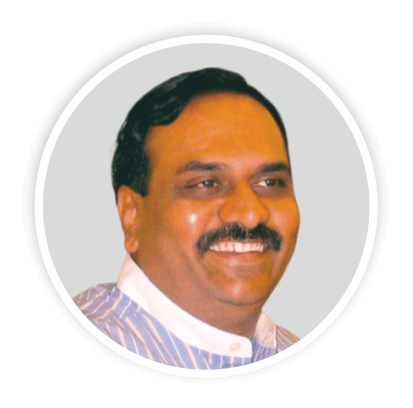
PID Sunil Kumar Rumalla
India Progress Towards Targets
| MDs | Total Clubs | MISSION 1.5 New Club Target | New Club Actuals | % of New Clubs Achieved | MISSION 1.5 New Member Target | New Members Actuals | % of New Members Target Achieved | MISSION 1.5 Net Gain Target | Gain Or Loss Fiscal Year Period | % of Net Gain Achieved | MISSION 1.5 Recruitment Target | Recruitment Actuals | % of Recruitment Achieved |
|---|---|---|---|---|---|---|---|---|---|---|---|---|---|
|
Multiple District 316
|
407 |
60 |
68 |
113% |
3466 |
3813 |
110% |
1195
|
1635
|
137%
|
4666
|
5385
|
115%
|
|
Multiple District 317
|
696 |
93 |
66 |
71% |
3766 |
3127 |
83% |
1802
|
1169
|
65%
|
5626
|
4799
|
85%
|
|
Multiple District 318
|
847 |
86 |
71 |
83% |
4358
|
3438
|
79%
|
2312
|
1158
|
50%
|
6078
|
5134
|
84%
|
|
Multiple District 320
|
682
|
118
|
132
|
112%
|
5951
|
5679
|
95%
|
2178
|
997
|
46%
|
8311
|
9156
|
110%
|
|
Multiple District 321
|
1227
|
125
|
132
|
106%
|
8644
|
5181
|
60%
|
2549
|
1348
|
53%
|
11144
|
8418
|
76%
|
|
Multiple District 322
|
1154
|
161
|
179
|
111%
|
8156
|
9046
|
111%
|
3351
|
3768
|
112%
|
11376
|
13382
|
118%
|
|
Multiple District 3231
|
302
|
39
|
33
|
85%
|
2050
|
1593
|
78%
|
847
|
498
|
59%
|
2830
|
2335
|
83%
|
|
Multiple District 3232
|
484
|
99
|
105
|
106%
|
3959
|
6718
|
170%
|
1595
|
2332
|
146%
|
5939
|
9357
|
158%
|
|
Multiple District 3233
|
956
|
77
|
171
|
222%
|
4183
|
2829
|
68%
|
1669
|
1503
|
90%
|
5723
|
6656
|
116%
|
|
Multiple District 3234
|
398
|
70
|
38
|
54%
|
3402
|
1779
|
52%
|
1381
|
-407
|
-29%
|
4802
|
2966
|
62%
|
|
Multiple District 3241
|
854
|
108
|
87
|
81%
|
7937
|
3815
|
48%
|
2095
|
957
|
46%
|
10097
|
5737
|
57%
|
|
Multiple District 3242
|
1030
|
79
|
116
|
147%
|
10150
|
5679
|
56%
|
2968
|
3485
|
117%
|
11730
|
8686
|
74%
|
|
India Total
|
9037
|
1115
|
1198
|
107%
|
66022
|
52697
|
80%
|
23942
|
18443
|
77%
|
88322
|
82011
|
93%
|
High Percentage of Membership Growth
As of June 30, 2026
| District | Total Membership | Gain Or Loss Fiscal Year Period | % Membership Growth as of 30th June 2026 |
|---|---|---|---|
|
District 3232B2
|
3318
|
817
|
33%
|
|
District 3233G2
|
3620
|
826
|
30%
|
|
District 3233 C
|
3231
|
725
|
29%
|
|
District 320 E
|
4566
|
1000
|
28%
|
|
District 3242 B
|
7195
|
1506
|
26%
|
|
District 317 A
|
2727
|
527
|
24%
|
|
District 316 B
|
2489
|
464
|
23%
|
|
District 322 H
|
1990
|
361
|
22%
|
|
District 321 F
|
5879
|
1045
|
22%
|
|
District 322C5
|
1660
|
283
|
21%
|